
Supplier portal
Bridge: the supplier data portal
Suppliers get a portal, a shorter and relevant set of questions, and a rating and badge at the end that helps them with their other customers too.
Supplier programmes and rated suppliers include



Who uses Bridge, and what each gets
Suppliers answer through their own login, you follow progress and receive the consolidated view, and our analysts or your Visiting Sustainability Officer (VSO) chase, check and score.
Your suppliers
What they do
Answer questions filtered to their operations, through their own secure login, with guidance in each question and documents uploaded against answers.
What they get
A scorecard, rating band and certificate, and a profile that persists, so next cycle is an update, not a redo.
Your procurement team
What they do
Follow each supplier’s progress, which is visible to both sides.
What they get
A consolidated view by category, region and spend band, a supply chain risk map, and primary data for Scope 3.
Our analysts or your VSO
What they do
Chase, clarify and cross-check responses against supporting documents, then score each supplier and place it in a rating band.
Most programmes start with the top 10 to 20 suppliers by spend or criticality.
What Bridge records
A supplier who completes an assessment for you has built something reusable: a verified profile and a rating they can present elsewhere.
- Each supplier gets their own secure login.
- Questions filter to the supplier’s actual operations.
- Guidance written into each question, explaining where the answer sits in their records.
- Documents uploaded against the answer they support.
- Progress visible to both sides.
- Scorecards and rating certificates issued through the portal.
- A supplier profile that persists, so next cycle is an update, not a redo.
Every answer carries
- Guidance in the question
- The answer
- Documents uploaded against it
- Progress both sides can see
Two layers of data
- Layer 1, through Bridge. Products and quantities, energy, fuel types, waste streams, water, transport.
- Layer 2, questionnaire. Policies, certifications, safety systems, targets.
Supplier rating bands
| Band | Score | What it signals |
|---|---|---|
| Platinum | Above 90 | Genuinely leading. Systems, data and third-party verification all in place. |
| Gold | 75–90 | Strong performer. Minor gaps only. |
| Silver | 60–74 | Competent. Doing the fundamentals, missing the formal systems. |
| Bronze | 45–59 | Early stage. Basic compliance, little measurement. |
| Committed | Below 45 | Has engaged, but has substantial ground to cover. |
Six steps, one cycle
Primary data replaces spend-based estimates in the categories where accuracy matters most.
- Segment the supplier base. We tier by spend, criticality and ESG risk, then set the level of assessment per tier.
- Onboard through Bridge. Suppliers get their own login, with clear instructions on what is needed, why, and where to find it.
- Collect and validate. Responses arrive through the portal. We chase, clarify and cross-check against supporting documents.
- Score and rate. Each supplier is scored across core pillars and placed in a rating band.
- Issue scorecards and certificates. Suppliers receive their own scorecard and badge; you receive the consolidated view.
- Feed your Scope 3 accounting. Primary data replaces spend-based estimates in the categories where accuracy matters most.
How the four tools connect
You do not have to adopt all of them. Most clients start with one and add others as obligations grow. Adding tools later never requires re-entering historical data.
-
Assessment data
Pulse
SIM assessment and internal ESG data from your own departments
Sub-pillar performance, scores, and the evidence index
-
Carbon accounting
Karbon
Energy, fuel and activity data for carbon accounting
Emissions by scope, intensity metrics, progress against reduction targets
-
Supplier portal
Bridge
ESG data from your suppliers and vendors
Supply chain ratings, risk view, and primary Scope 3 data
-
ESG dashboard
Lenz
The consolidation layer. ESG data monitoring and tracking happen here.
The single dashboard leadership actually looks at.
In practice
VKC Pride, Kozhikode
Supplier ESG can be industrialised. A platform (Bridge), a transparent framework (SIM), and a tiering model turn a fragmented base into a structured, comparable dataset.
More than 55 active suppliers across 10 Indian states, about 78% of them MSMEs, with no standardised approach for collecting and reporting ESG information.
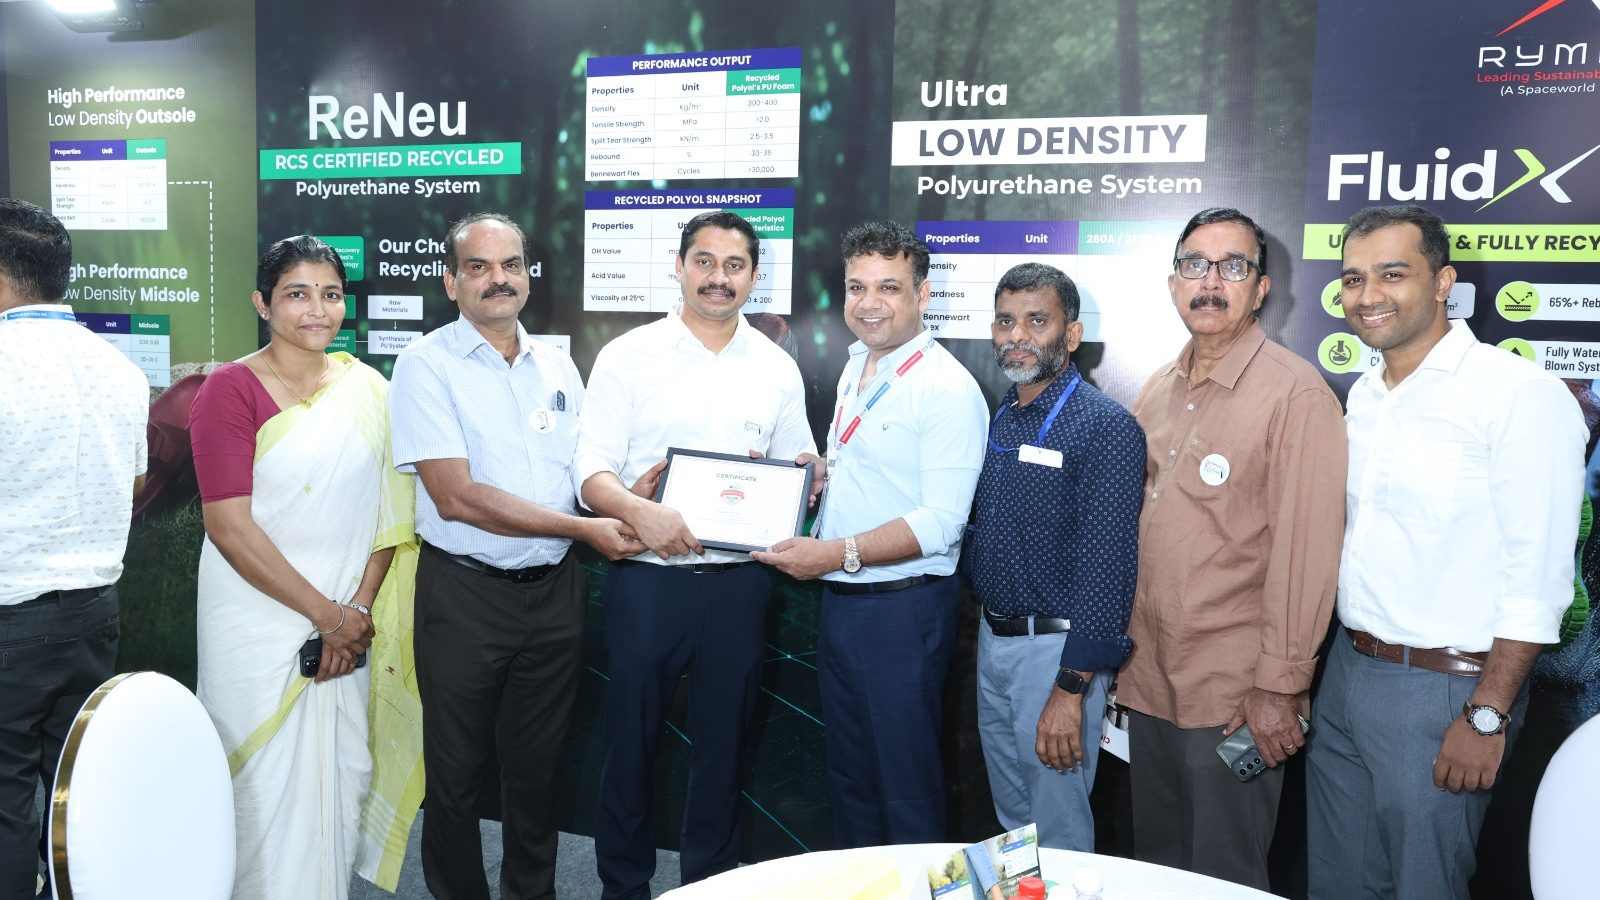
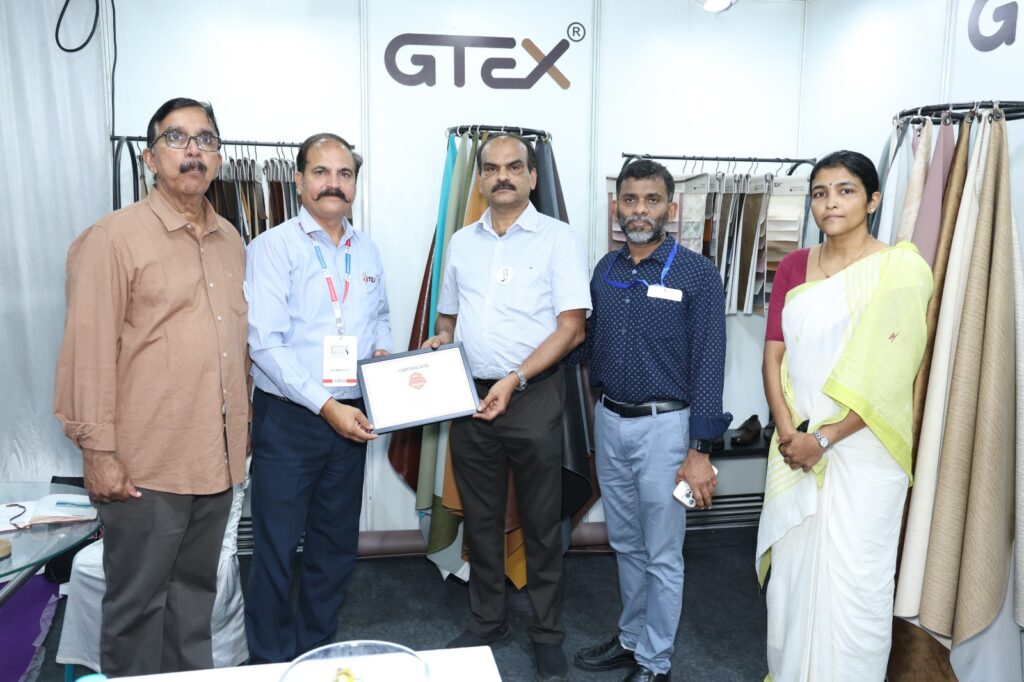
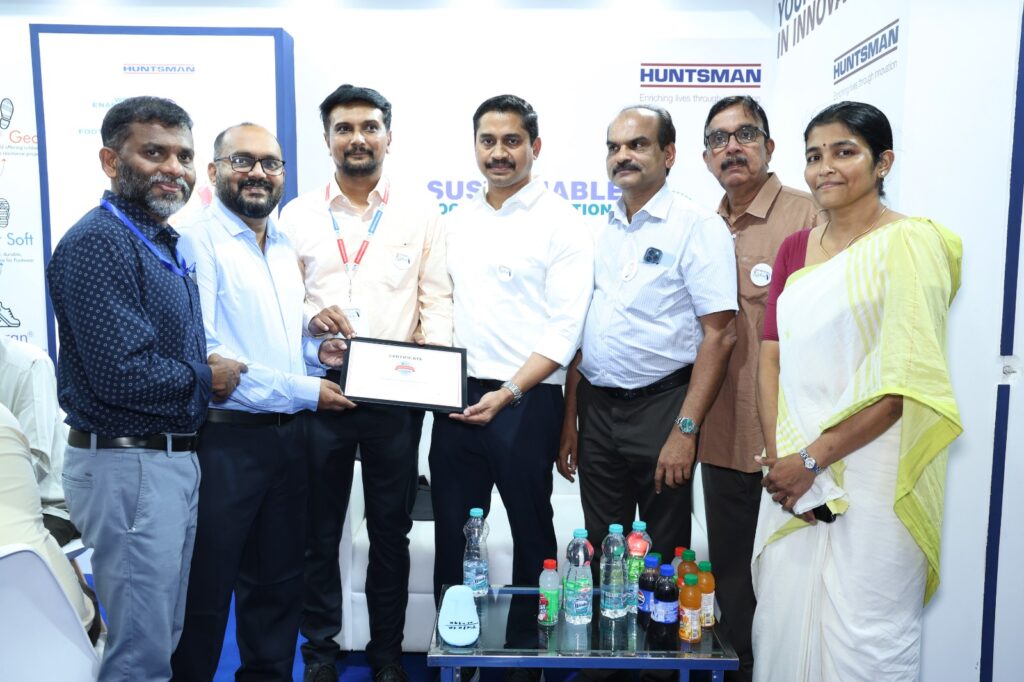
Suppliers were onboarded to Bridge and guided through foundational data submission. Each assessed supplier received a scorebook covering its tier, dimension scores, product profile and ESG highlights.
13
suppliers assessed through Bridge
55+
suppliers in the ecosystem, about 78% MSMEs, across 10 states
Tiers: 1 Platinum · 2 Gold · 1 Silver · 3 Bronze · 6 Committed

Questions about Bridge
Something we have not covered? Ask us directly.
How many suppliers should we start with?
Start with the ones that matter: typically the top 10 to 20 by spend or by criticality. Covering everyone in year one can be tedious.
What if a supplier refuses to participate?
That is useful information in itself. We report non-response separately, so you can decide commercially. In practice, a structured supplier ESG assessment brings most suppliers in because the resulting badge and scorecard help them with their other customers too.
Does this give us our Scope 3 number?
It gives you real, primary data for the categories that depend on suppliers, which is far better than spend-based estimates. We usually run this alongside a full GHG inventory.
Can suppliers use their badge elsewhere?
Yes, and we encourage it. That is precisely what makes them willing to do the work.
Do we have to adopt all four tools?
You do not have to adopt all of them. Most clients start with one and add others as obligations grow. Adding tools later never requires re-entering historical data.
Where do we log in?
Not on this website, which has no client logins. Platform data is handled under your engagement.
Turn your supplier list into supplier data
Tell us what you had to gather last time, and we will show you what capturing it continuously would look like.
Email [email protected]
Phone +91 81291 68649
Send us a message
Tell us what you are being asked for, and by whom. We reply within one working day.